Environmental nutrients
The environmental availability of certain nutrients on which microbes depend can deeply shape the composition of the microbiome. Chemically speaking, nutrients are very diverse in molecular weight, composition and complexity. In this project we will classify them into two main groups:
- Organic nutrients: Total organic carbon (TOC), and total organic nitrogen (TON).
- Inorganic nutrients: silicate [Si(OH)₄], phosphate (PO4³⁻), ammonium (NH₄⁺), nitrate (NO₃⁻) and nitrite (NO₂⁻).
1 Did different nutrients have similar concentrations?
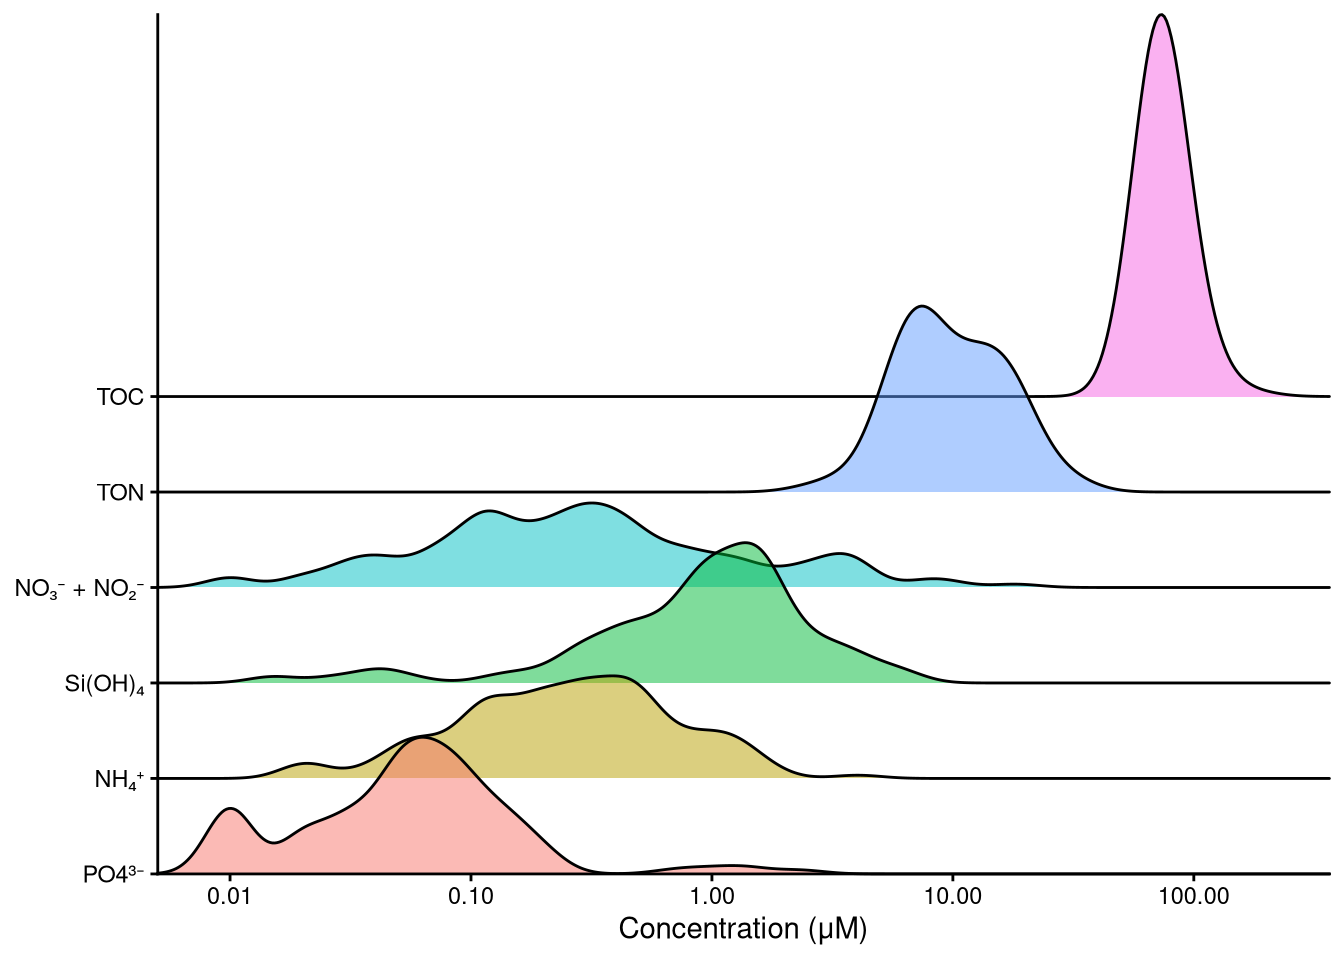
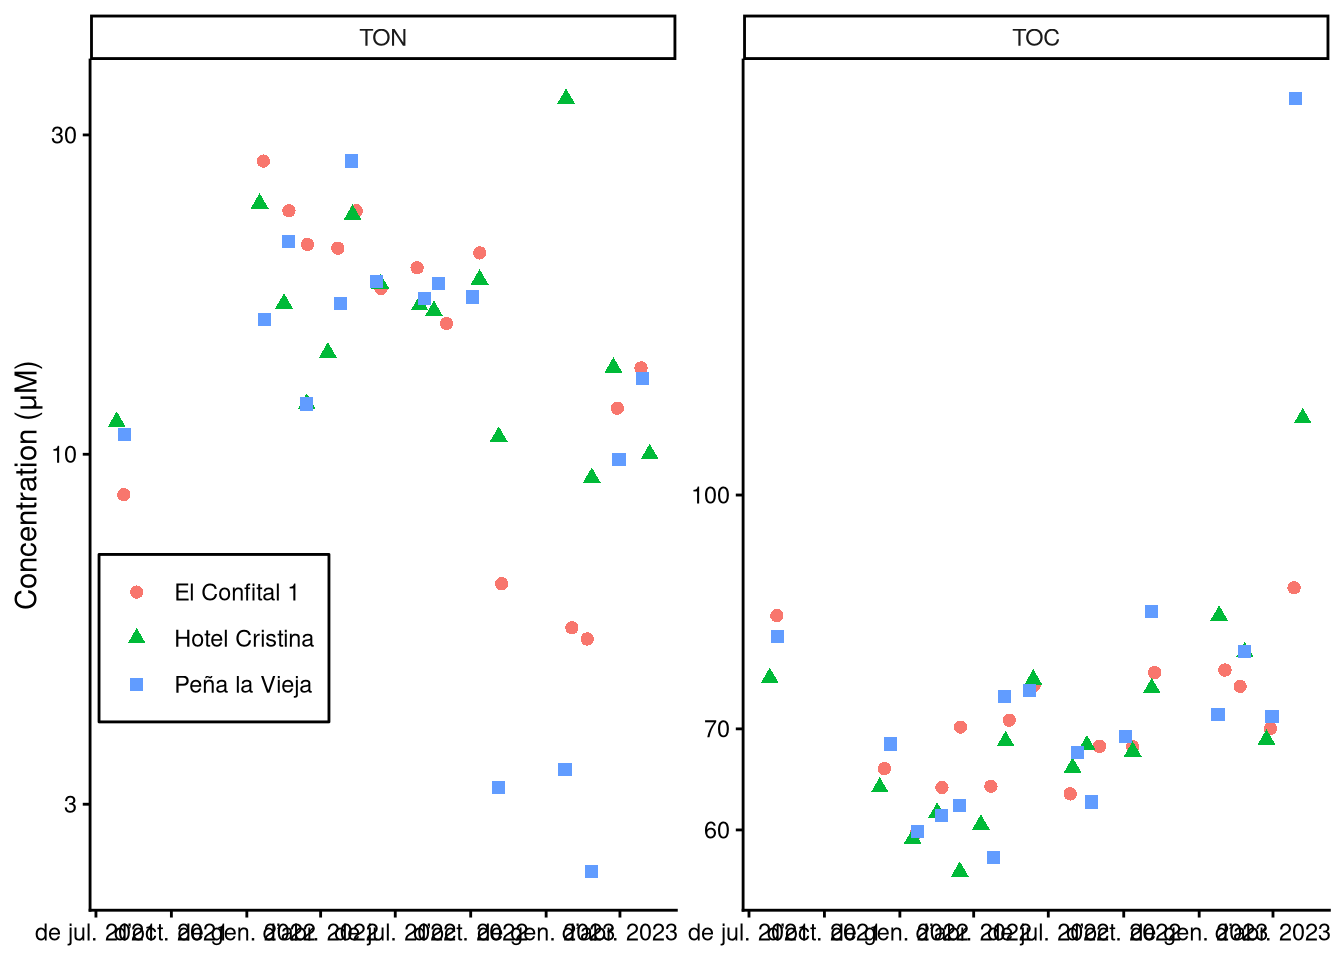
By observing overall distribution in Figure 1, we can pinpoint an evident difference between organic and inorganic nutrients. That is, organic nutrients concentration ranges are two to three orders of magnitude higher—TOC close to 100 μM, and TON around 10 μM. This proportion is representative of the Redfield (1933) ratio, which quantifies elemental concentrations of marine organic matter according to the proportion \(C:N:P = 106:16:1\). This proportion is highly representative of our data.
2 Were there differences between sampling stations?
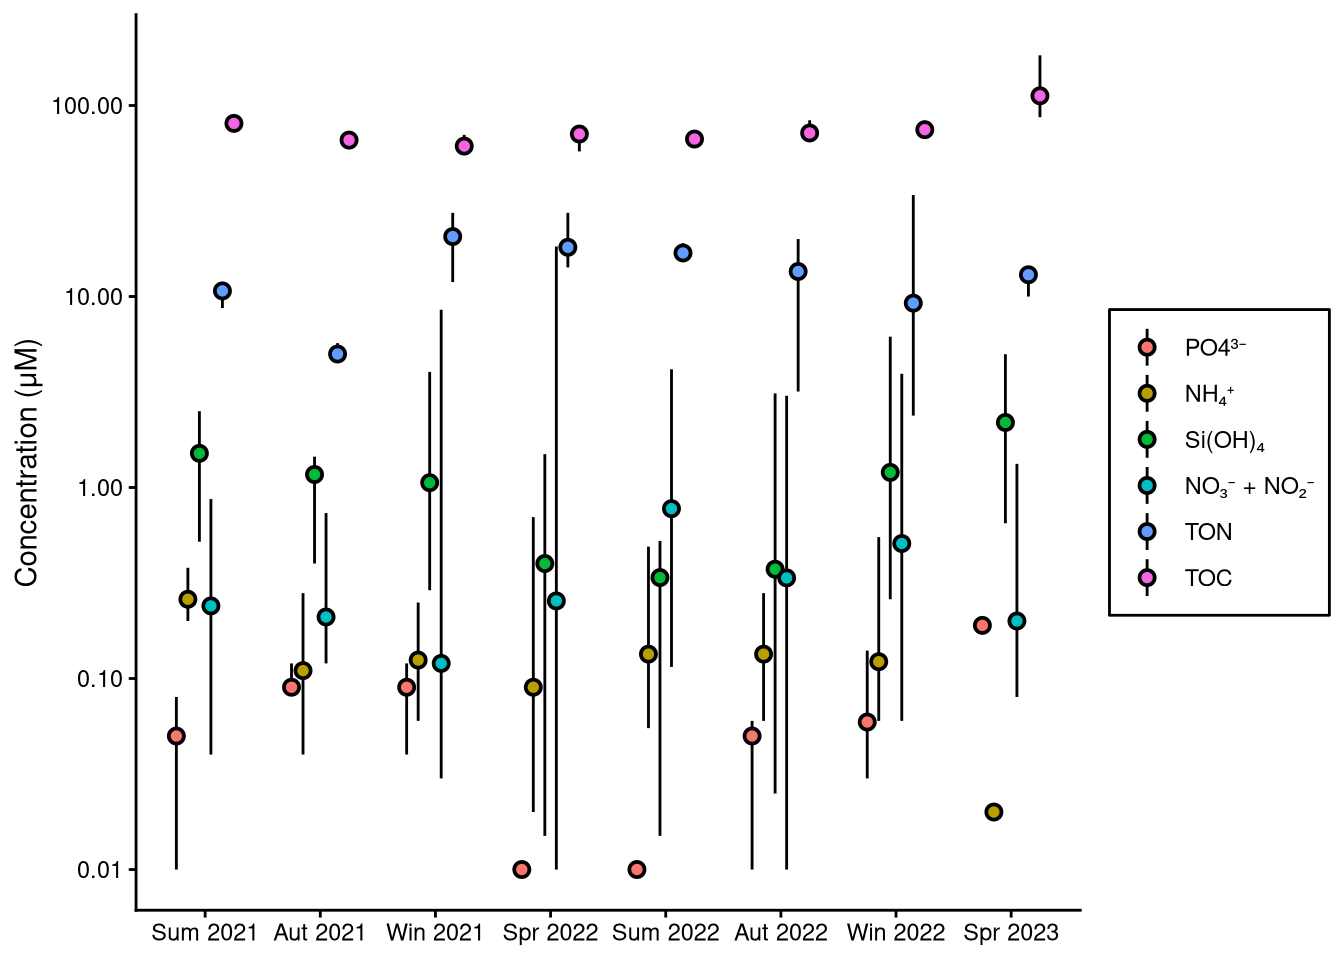
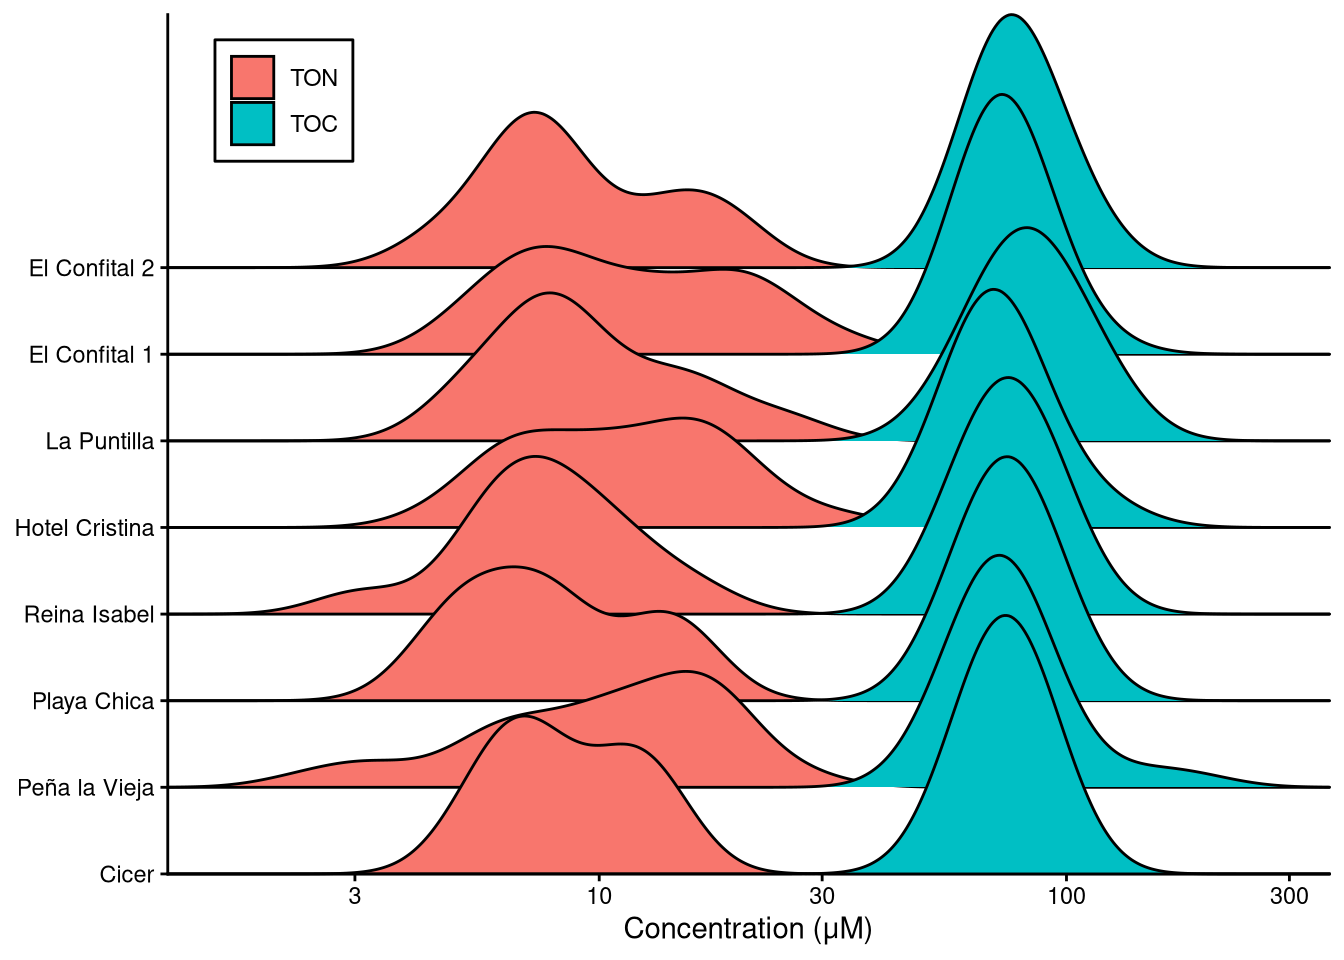
Observing Figure 3, it is clear at first glance that TOC concentration across the coast is more homogeneous than that of TON. The TOC maximum of Peña la Vieja also stands out. Moving to figure Figure 5 we observe that it was measured at the end of the monitoring period in the spring of 2023. On the other hand, TON dropped in El Confital 1 and Peña la Vieja between October 2022 and April 2023. This is not the case at Hotel Cristina. Further investigation is needed in order to understand the factors driving these processes.
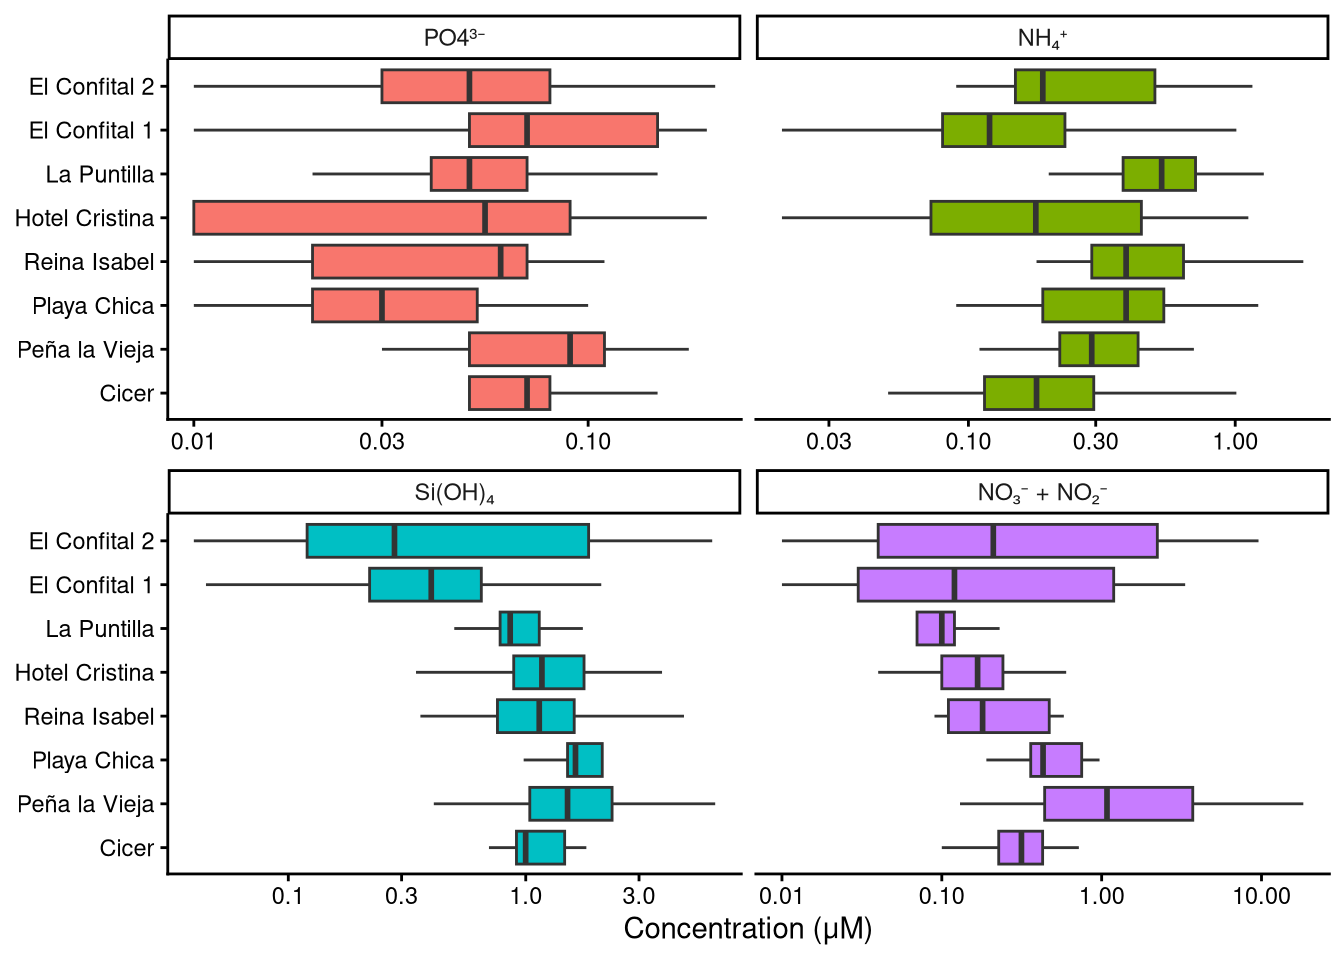
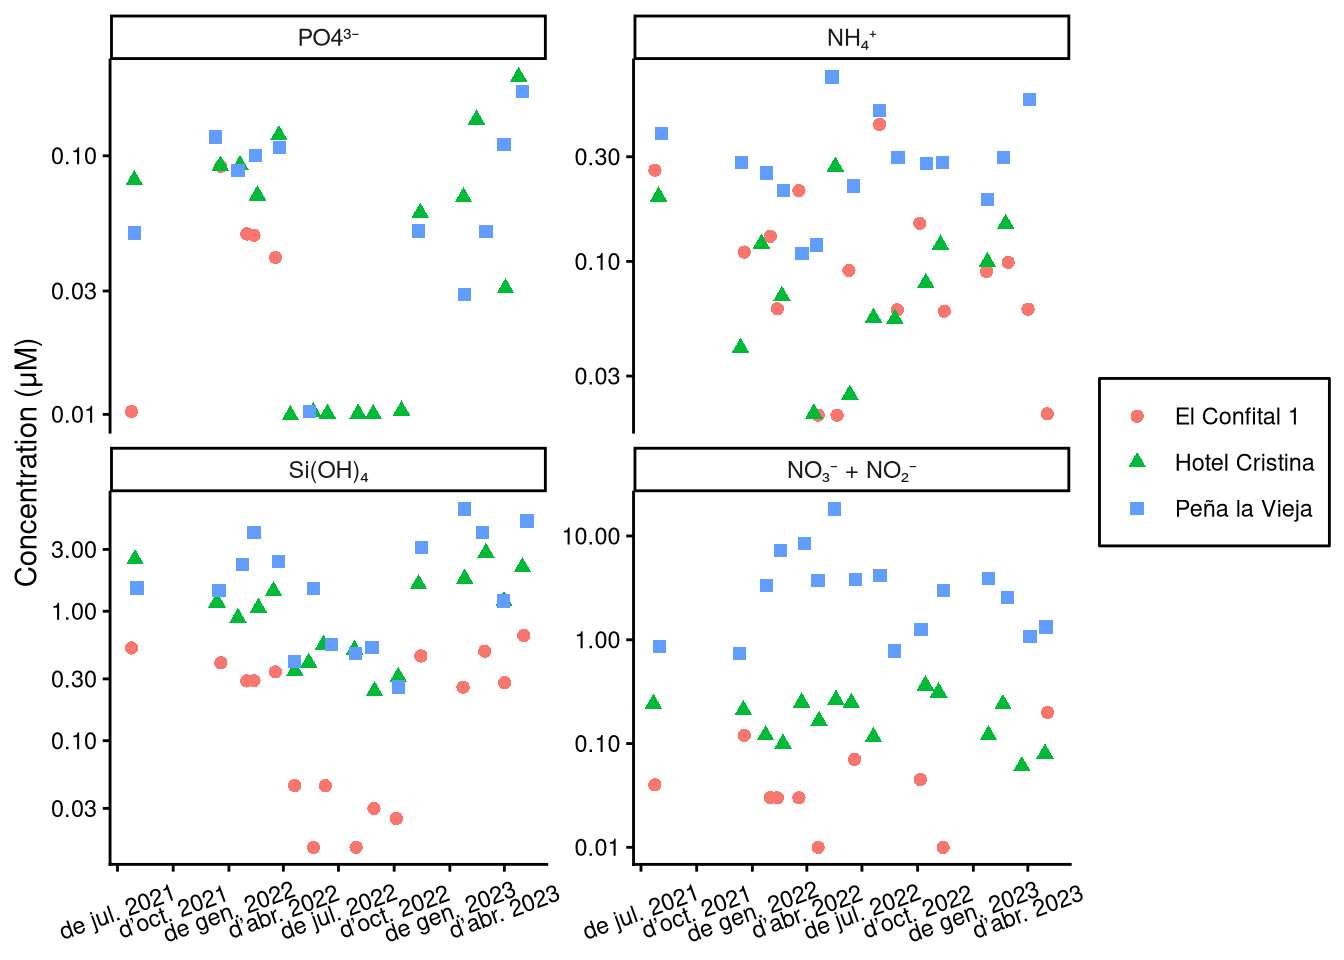
In both Figure 4 and Figure 6, we can observe a difference between El Confital and Las Canteras. Concretely, Si(OH)₄ and NO₃⁻ + NO₂⁻ concentration are overall higher in Las Canteras compared to El Confital. Within Las Canteras, these nutrients show a decreasing tendency as we move North. This pattern is representative of different land input regimes, whose shaping agents are the ravines located South of Las Canteras. Ravine discharge contains siliceous sediments from volcanic rocks as well as nitrtates. However, in Figure 4 shows an unusual distribution of NO₃⁻ + NO₂⁻ at Peña la Vieja, which could be an indicator of anthropogenic input of nutrients.
3 How did nutrient concentration change over time?
References
Redfield, Alfred C. 1933. “On the Proportions of Organic Derivates in Sea Water and Their Relation to the Composition of Plankton.” James Johnstone Memorial 1934: 176–92. https://hahana.soest.hawaii.edu/cmoreserver/summercourse/2012/documents/bronk_05-30-12/Redfield_1934.pdf.