Sea Surface Temperature
When it comes to environmental variables, temperature is often one of the most defining of environmental conditions, and also, one of the easiest to measure. Understanding sea surface temperature (SST) distribution across of monitoring program can help us understand natural fluctuations in the microbiome composition due to seasonal changes in the water.
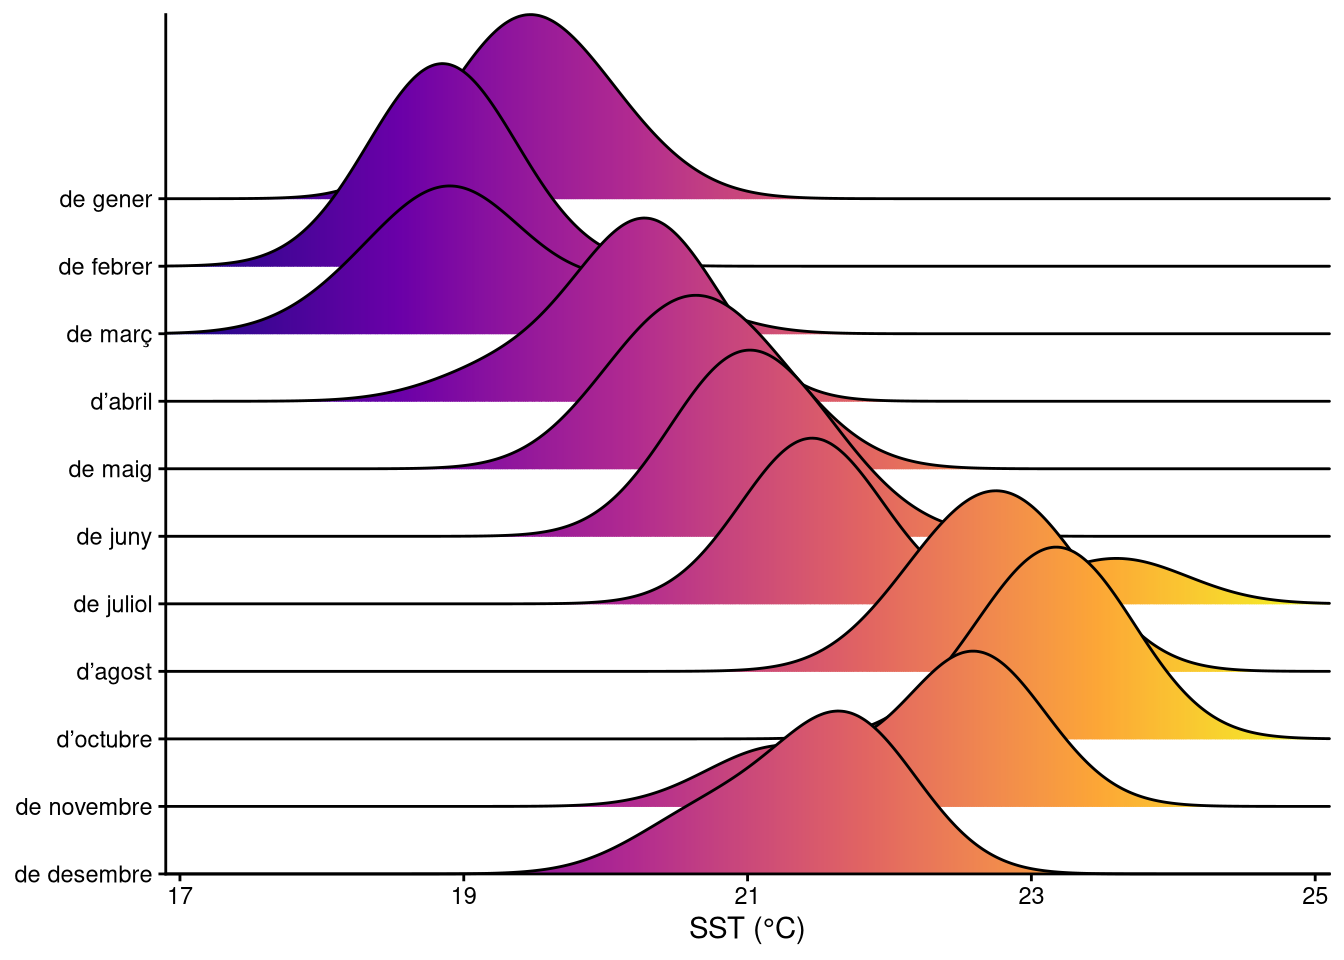
1 How did temperature vary over the year?
When we think about changes in seawater temperature over time, we tend to relate high temperatures with summer time. Although we mostly enjoy bathing at the beach in summer —June, July and August—, there’s a common misconception about seasonal SST variation in assuming that higher temperatures at sea occur simultaneously with atmospheric temperatures. This is not exactly the case. As you can observe in Figure 1, lowest annual SST is recorded in March, which also marks the arrival of the spring. The highest temperature, on the contrary, is measured in October, for us commonly associated with the beginning of the autumn.
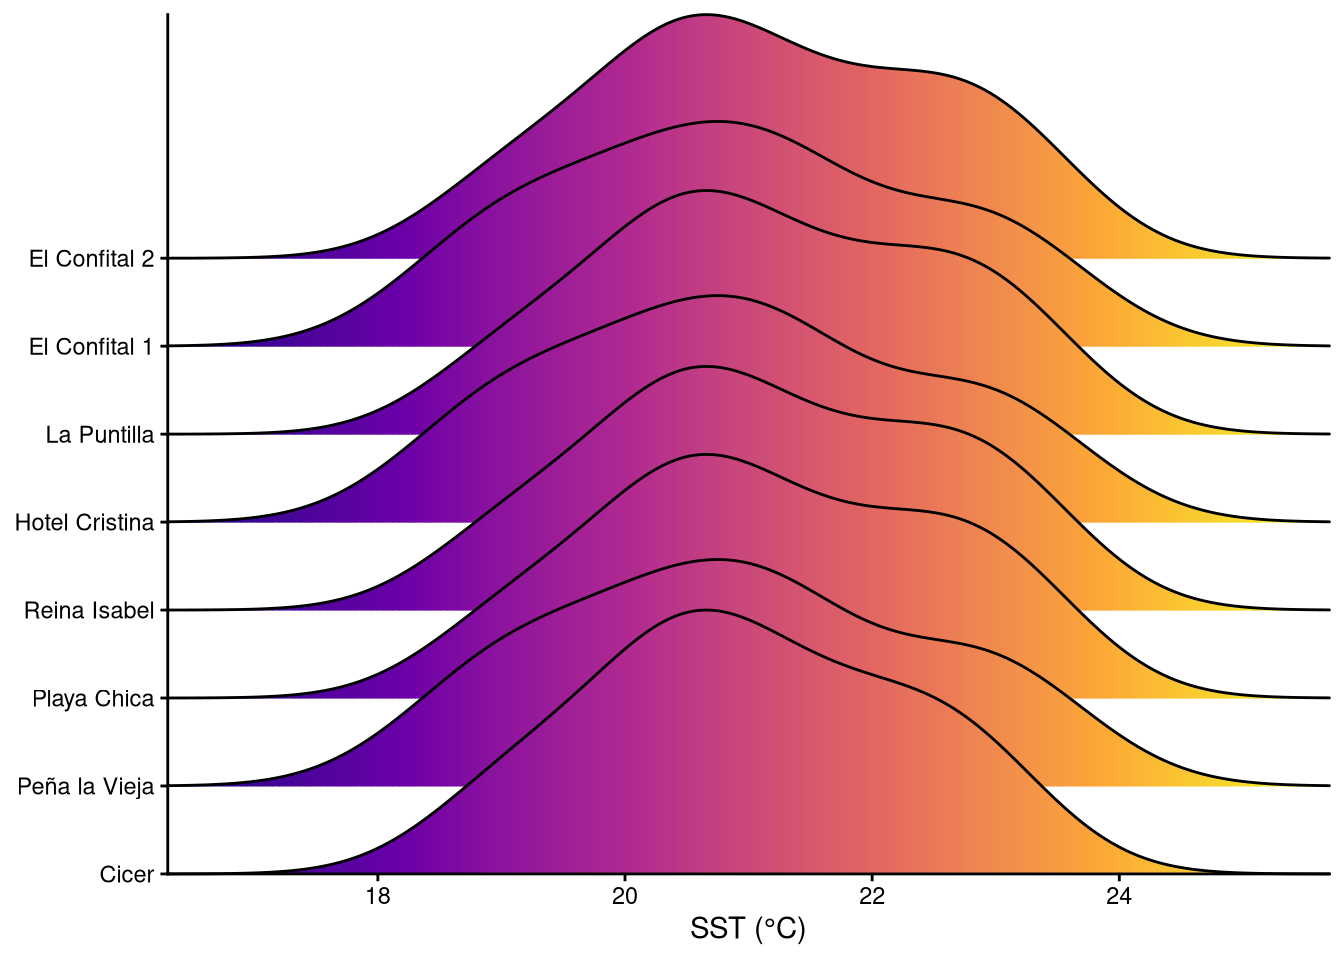
2 Was there any difference between sampling stations?
Although we generally understand the sea surface as mostly homogeneous in temperature at a local scale, morphological and bathymetrical factors can possibly create spatial differences in distributions. Las Canteras beach is partially closed to the open sea by a morphological feature known as la Barra [the Barrier]. However, as shown in Figure 2, this doesn’t seem to be the case from an overview perspective. It’s important to note that la Barra is significantly eroded, and open surface waters can reach the closed water mass daily at high tide.